
Posts: 3960

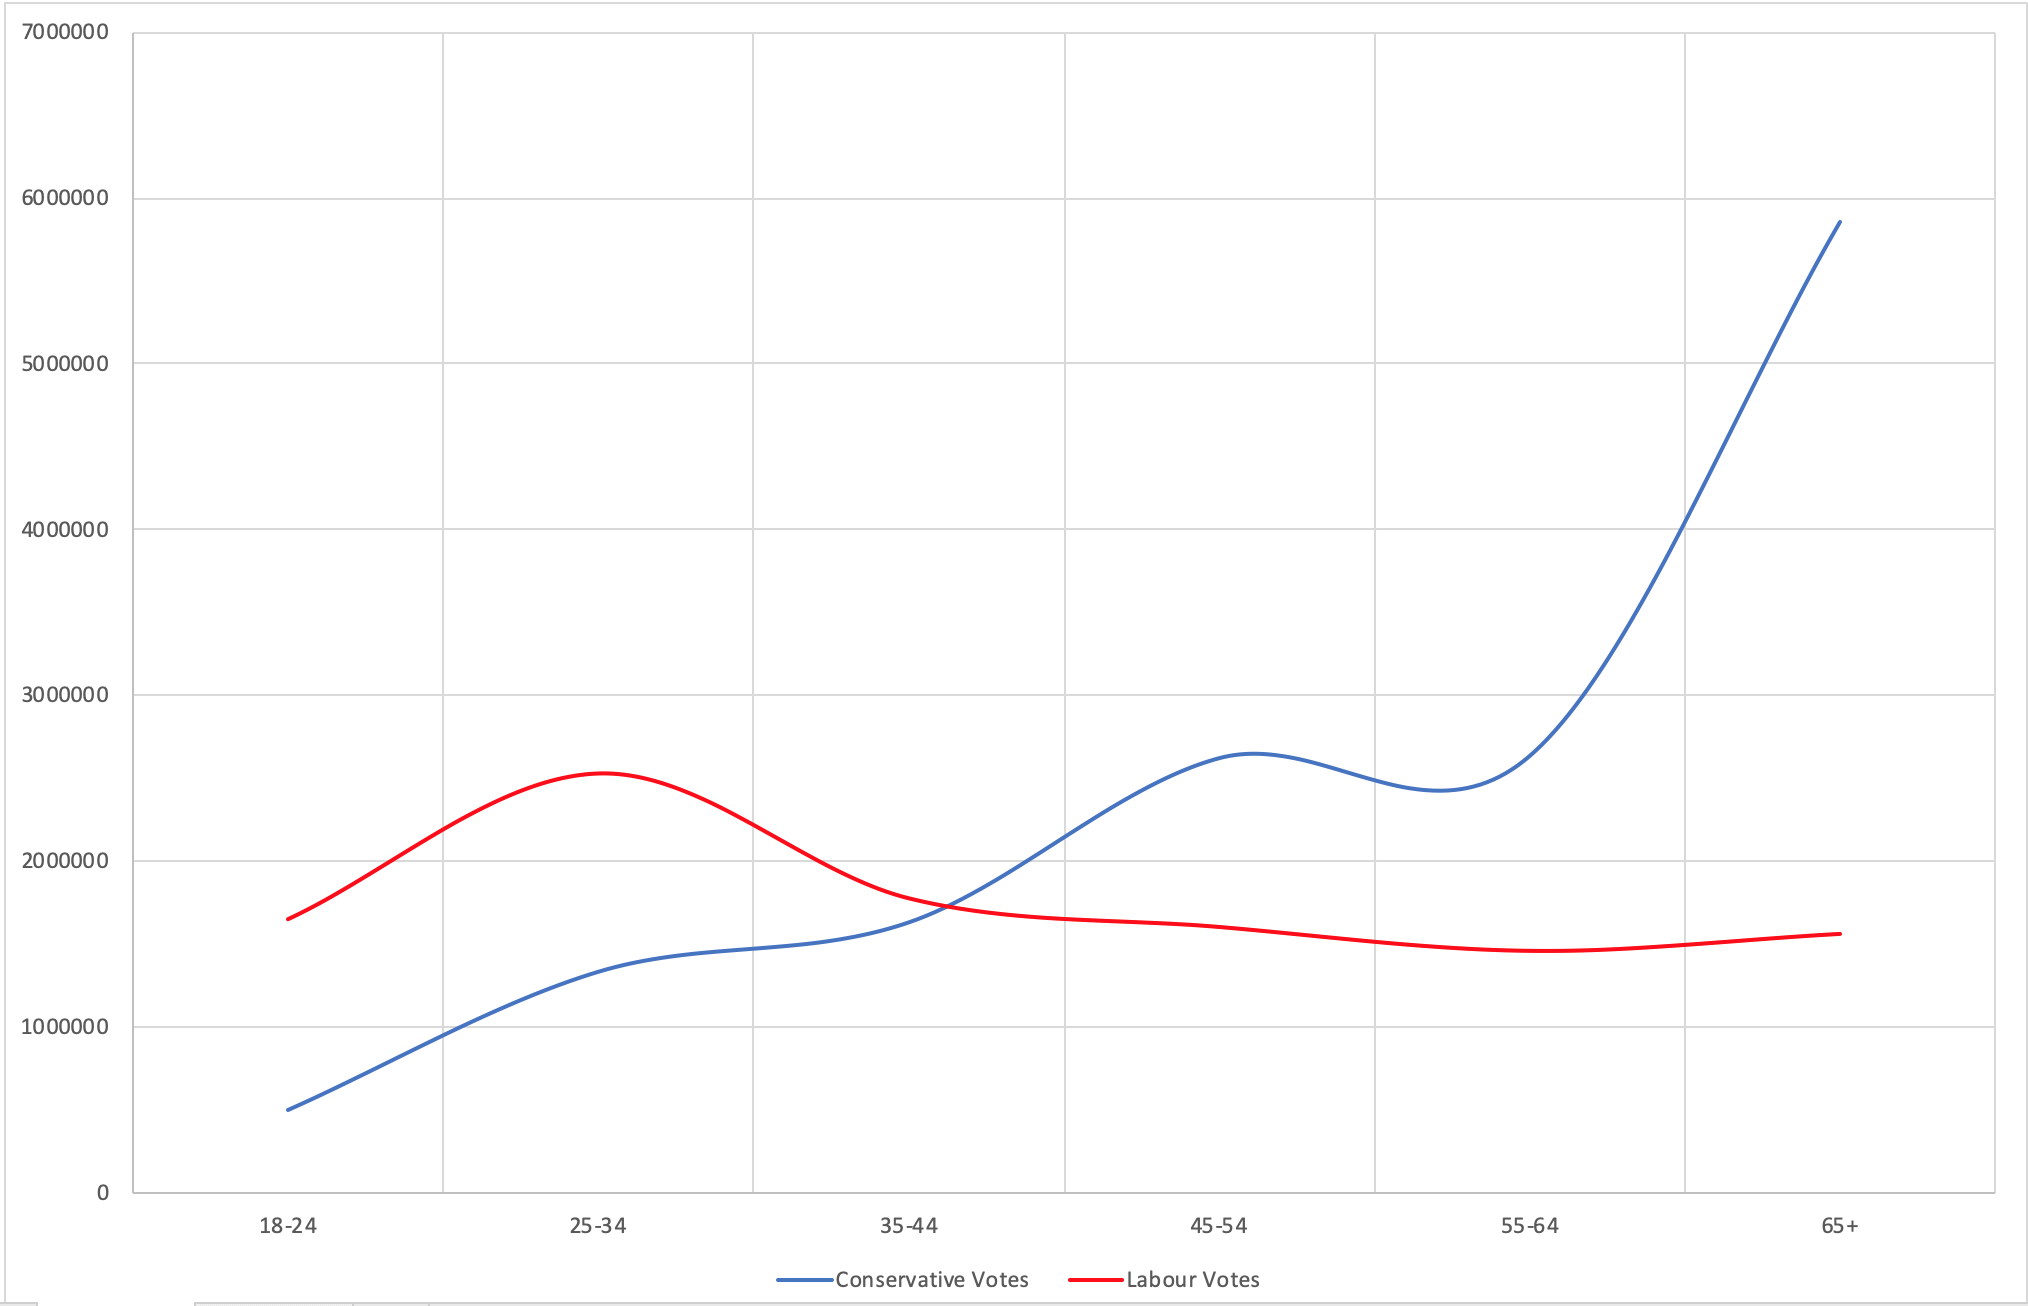
posted on 20/6/2020 02:59I don't think it's that massive at all... those charts tell something of a false narrative - Marchie
1) The 18-24 age group is over-represented on a population basis, while the 65+ category is under-represented. UK population by age category:
2) It takes no account of voter turnout in those age categories:
Weighted for population and turnout, the 2019 chart looks like this:
- The Marches. Stout yeomen standing firm between civilisation and the Welsh. -
- 18-24: 5,647,655
- 25-34: 9,011,381
- 35-44: 8,415,206
- 45-54: 9,063,137
- 55-64: 8,161,093
- 65+: 12,374,961
2) It takes no account of voter turnout in those age categories:
- 18-24: 47%
- 25-34: 55%
- 35-44: 54%
- 45-54: 63%
- 55-64: 66%
- 65+: 74%
Weighted for population and turnout, the 2019 chart looks like this:
- The Marches. Stout yeomen standing firm between civilisation and the Welsh. -

- Powerful stuff (c & p obv) - bitterblue 19/6 08:43 (read 10427 times, 9 posts in thread)
- Re: Powerful stuff (c & p obv) - nomad 20/6 17:28 (read 10585 times)
- Yes some good points albeit a bit superficial. It misses a massive thing, which is this - Gramsci. 19/6 12:40 (read 10546 times)
- I don't think it's that massive at all... those charts tell something of a false narrative - Marchie 20/6 02:59 (read 11000 times)
- I think it is massive - Gramsci. 20/6 10:01 (read 10748 times)
- My own view, as someone at the very beginning of the 35-44 age group - Marchie 20/6 15:15 (read 11051 times)
- I think you're right - Gramsci. 20/6 15:49 (read 10676 times)
- My own view, as someone at the very beginning of the 35-44 age group - Marchie 20/6 15:15 (read 11051 times)
- I think it is massive - Gramsci. 20/6 10:01 (read 10748 times)
- That can be interpreted in a number of ways - bitterblue 19/6 12:56 (read 10146 times)
- No, I agree with you - Gramsci. 19/6 13:08 (read 10111 times)
- I don't think it's that massive at all... those charts tell something of a false narrative - Marchie 20/6 02:59 (read 11000 times)